Ваш браузер устарел. Рекомендуем обновить его до последней версии.
+7 495 005-85-85
[email protected]
Заказать технику
Заказать технику
>
Аренда спецтехники
>
Грузовые перевозки
>
Доставка бетона
>
Цены
>
Заказать спецтехнику
>
Контакты
>
О нас
Аренда спецтехники.
МОСКВА
ЛОГИСТИК.
Взять
займ под залог спецтехники
на выгодных условиях.
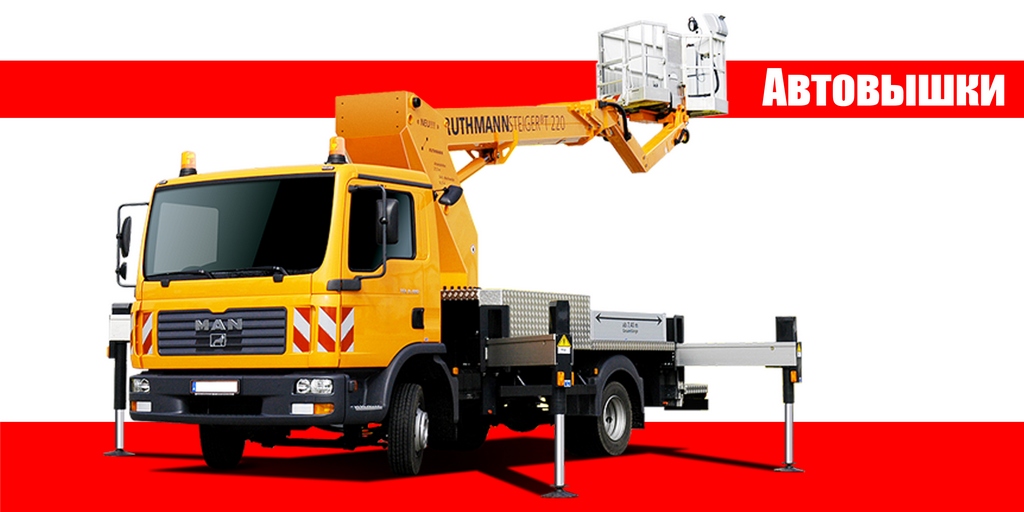
Аренда автовышки от 18 метров до 54 метров. В наличии автовышки отечественого и иностранного производства, с телескопической и коленчатой стрелой. Нажмите на ссылку чтобы узнать стоимость аренды
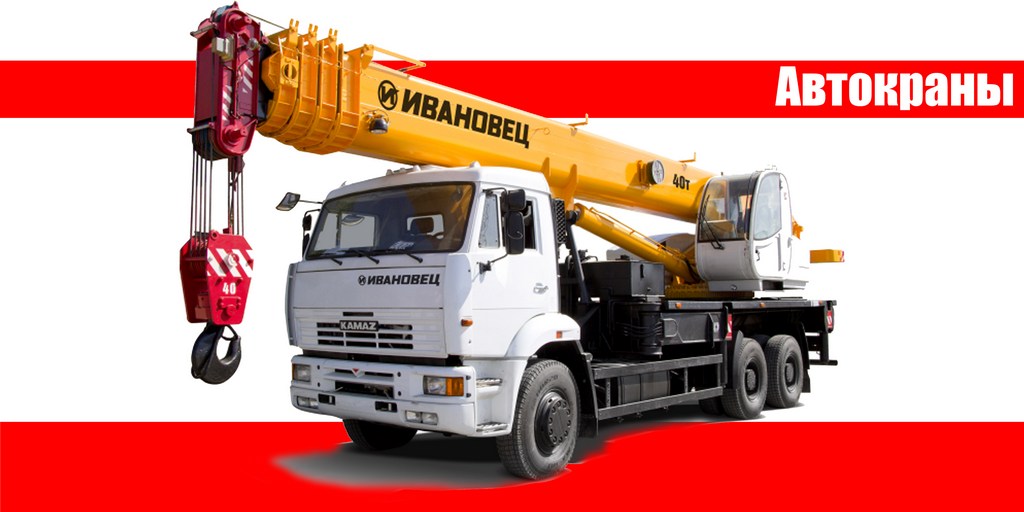
Аренда автокрана от 16 тонн до 500 тонн со стрелой от 20 метров. Большой автопарк автокранов. Всегда в наличии и свободны автокраны 16, 20, 25, 32 и 40 тонн. Нажмите на ссылку чтобы узнать стоимость аренды
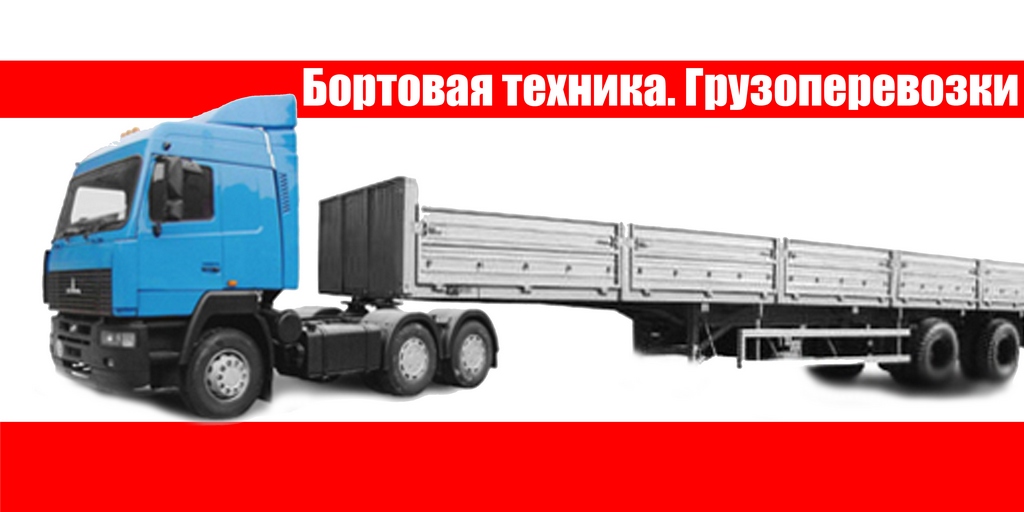
Аренда бортового КАМАЗ, МАЗ, MAN, и другой техники для перевозки грузов. Техника от 10 тонн до 30 тонн. Низкорамные платформы и техника с высокими бортами. Перевозка бытовок, опалубки, бетонных блоков, тротуарных плит и др. грузов. Нажмите на ссылку чтобы узнать стоимость аренды
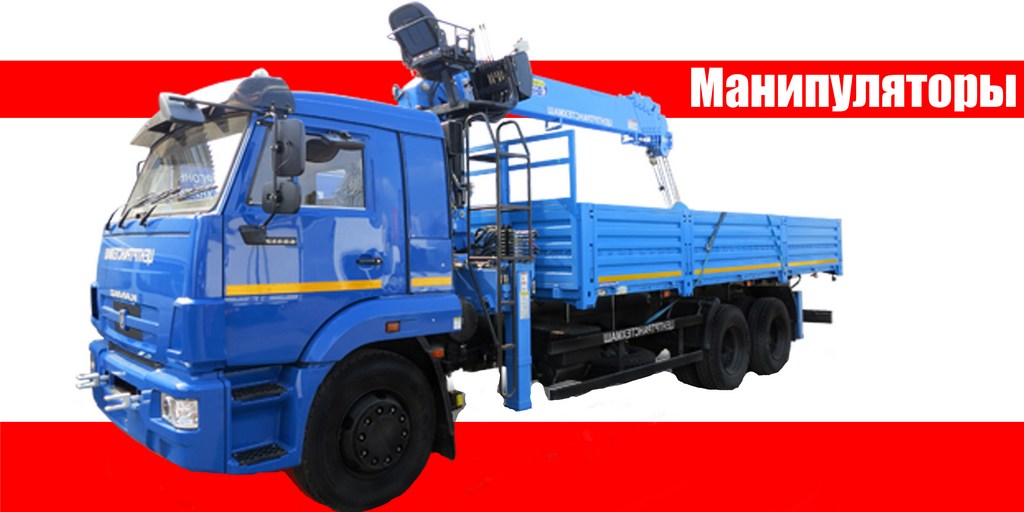
Аренда манипулятора со стрелой от 3 тонн до 15 тонн. Всегда в наличии манипуляторы 3, 5, 7, 10 тонн. Грузоподъемность от 5 тонн. Нажмите на ссылку чтобы узнать стоимость аренды
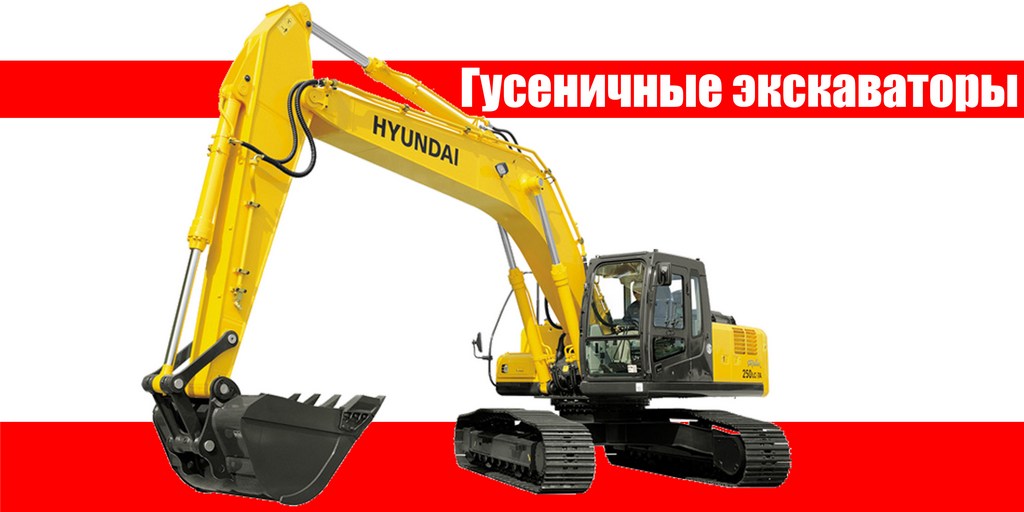
Аренда гусеничного экскаватора в Москве. Объем ковша от 1,1 до 2,5 м3. Транспортировка силами заказчика или нашими силами. Быстрая подача техники. Любая форма оплаты. Нажмите на ссылку чтобы узнать стоимость аренды
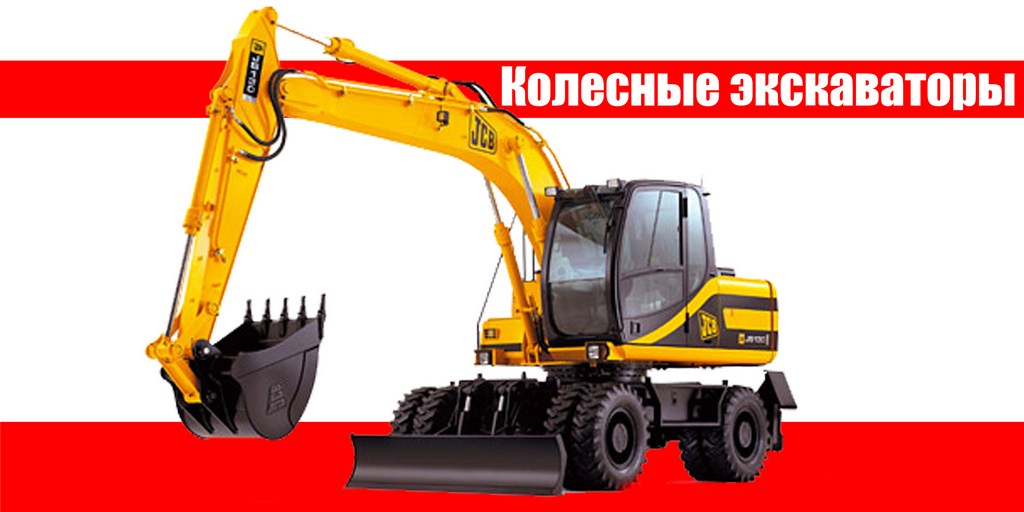
Колесный полноповоротный экскаватор в аренду в Москве и Московской области. Большой автопарк экскаваторов. Всегда свободная техника. Доставка в кратчайшие сроки на объект заказчика. Профессиональные машинисты.
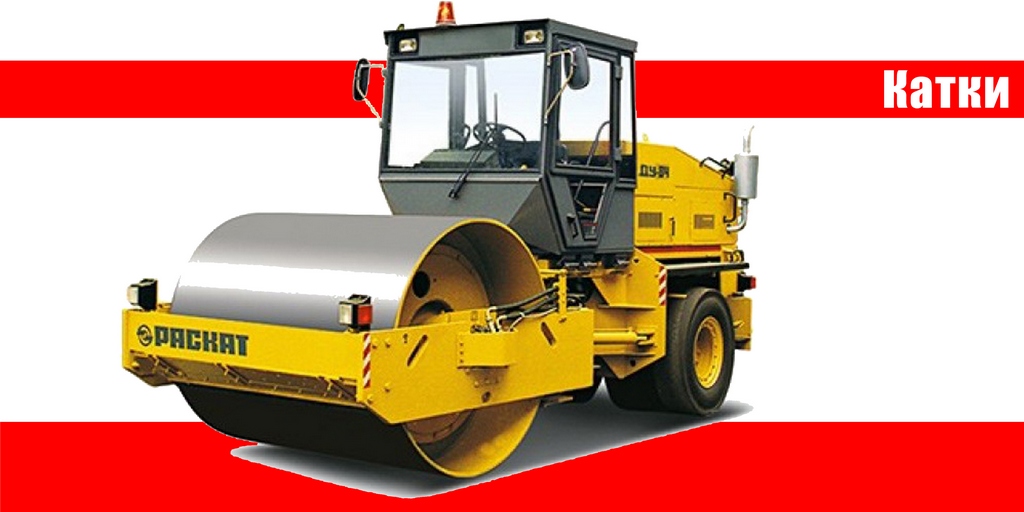
Аренда катка в Москве и Московской области. У нас можно заказать асфальтовый и грунтовый каток от 4 тонн до 18 тонн. Доставка техники на объект заказчика. Круглосуточная тех. поддержка. Нажмите на ссылку чтобы узнать стоимость аренды
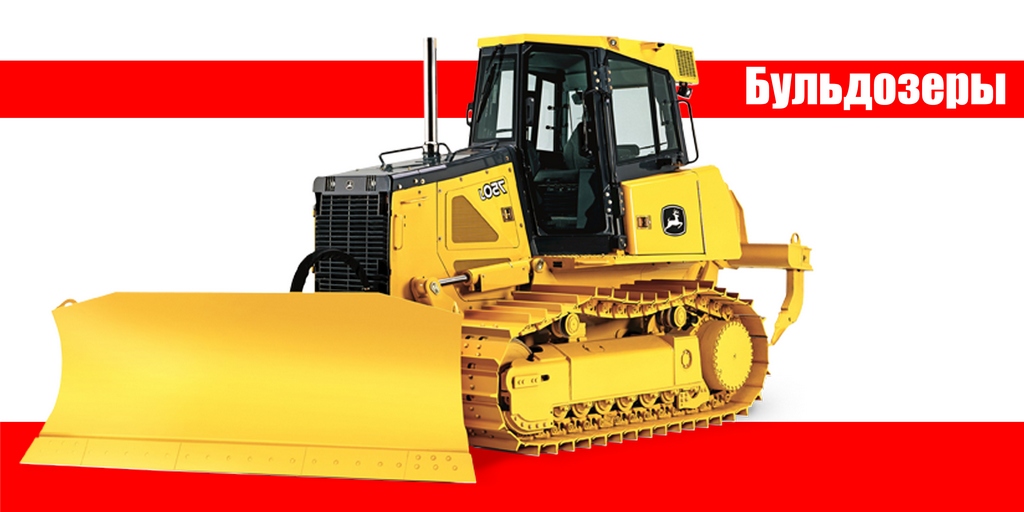
Аренда бульдозера в Москве. Бульдозеры от 8 тонн до 54 тонн. Доставка в любой район. Быстрая подача техники. Любая форма оплаты. Нажмите на ссылку чтобы узнать стоимость аренды.
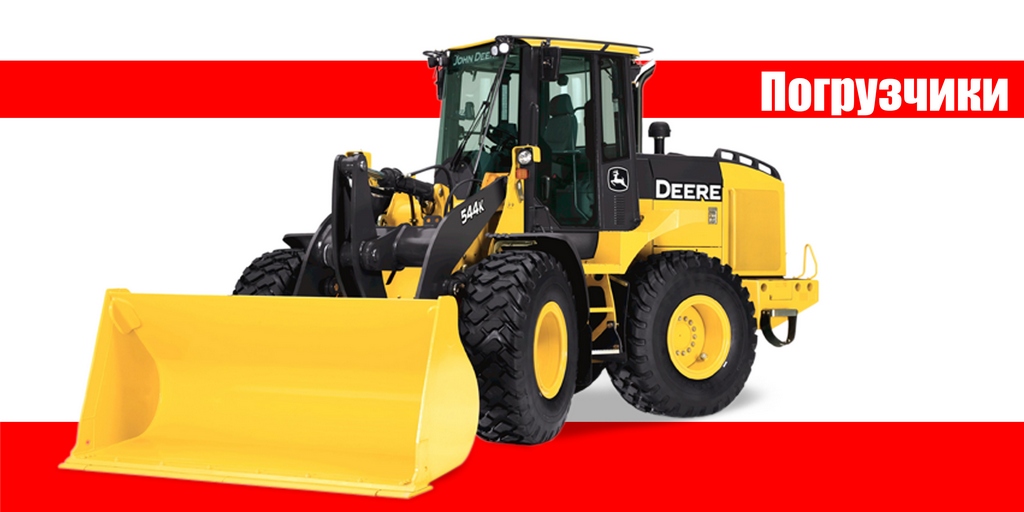
Аренда JCB 3CX, 4CX, Case, Volvo и других экскаваторов-погрузчиков в Москве и области. Быстрая подача техники на объект. Большой автопарк. Техника в собственности МОСКВА ЛОГИСТИК. Нажмите на ссылку чтобы узнать стоимость аренды
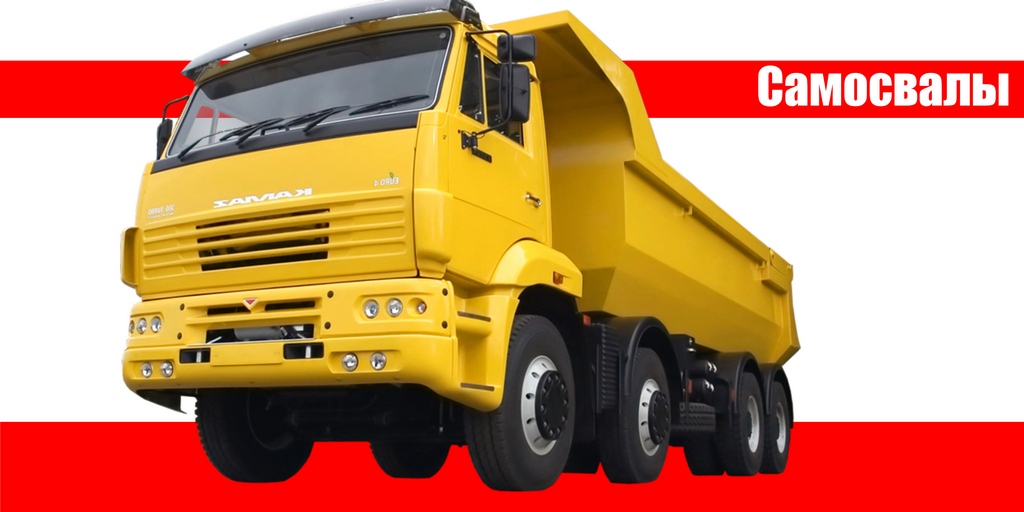
Услуги самосвала от 8 тонн до 40 тонн. Вывоз грунта, мусора, отходов и т.д. Перевозка щебня, песка, асфальта. Большой автопарк. Более 40 единиц самосвалов. Круглосуточная работа спецтехники. Нажмите на ссылку чтобы узнать стоимость аренды
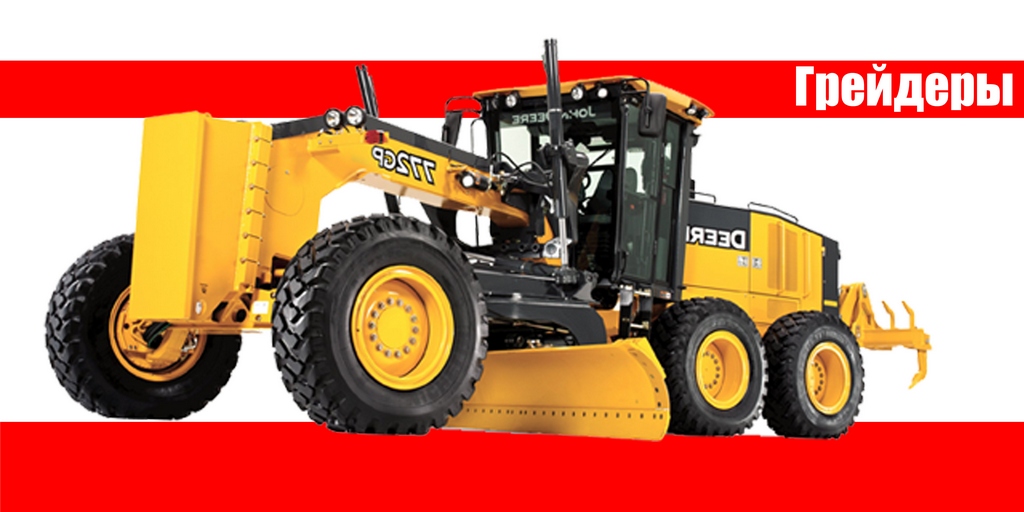
Аренда грейдера в Москве и Московской области. Опытные операторы. Консультация по подбору. Нажмите на ссылку чтобы узнать стоимость аренды
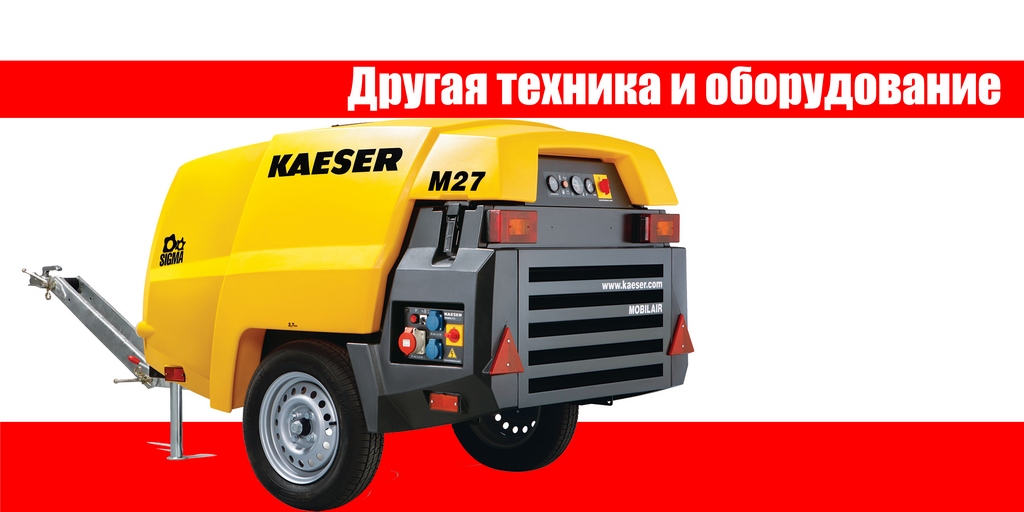
Аренда компрессора, генератора, поливомоечной машины и другой коммунальной техники и оборудования.
Мы предлагаем:
Аренда строительной, землеройной, асфальто-укладочной и другой техники.
Комплексное обслуживание строительных организаций по обеспечению спецтехникой и оборудованием.
Строительные работы: Рытье котлованов, вывоз мусора и снега, благоустройство территорий, планировка и озеленение и другие работы.
Перевозка негабаритных грузов и сопровождение.
Грузоперевозки по России и СНГ.
Складирование и логистика.
Стройматериалы:
Доставка бетона
,
щебень, песок
Наши партнеры: